Understanding candlestick charts for crypto trading
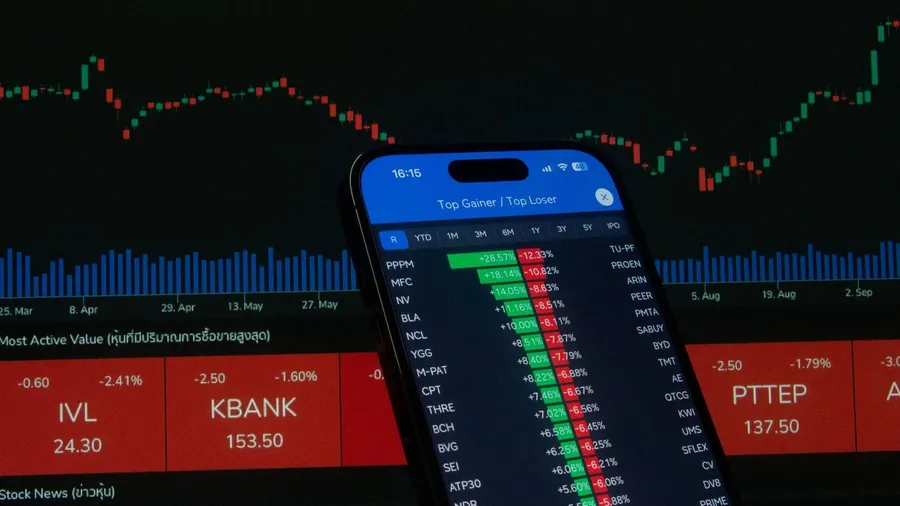
Candlestick charts provide detailed views of price movements in crypto, showing open, close, high, low, and volume for better trading insights.
 Jordan Fraser 4 min read
Build a candlestick from OHLC prices
Move the four prices. The body shows open-to-close movement; the wicks preserve the period's high and low.
This describes one completed period; it does not predict the next candle or provide a trading signal.
Candlestick charts look denser than a simple line chart, and that density is the point: a line connecting closing prices throws away most of what happened during each period, while a candlestick keeps it. The format originated with Japanese rice traders in the 18th century and has become the standard way to chart crypto, stock and forex prices because it packs more information into the same space without requiring a second chart.
What one candlestick shows
Most charting platforms, whether on a crypto exchange or a dedicated tool like TradingView, let a user switch between preset timeframes with a click, and the underlying data for every timeframe is generated from the same raw trade history, just aggregated into larger or smaller windows. Every candlestick represents a fixed time window, a minute, an hour, a day, whatever the chart is set to, and encodes four prices from that window: the open (the price at the start), the close (the price at the end), the high (the highest price reached) and the low (the lowest price reached). The thick rectangular part, the body, spans the distance between the open and the close. The thin lines extending above and below the body, the wicks or shadows, mark the high and low reached during the period, even if the price didn’t stay there.
Choosing a timeframe changes what you’re looking at
The same asset, on the same day, can look completely different depending on which timeframe a chart is set to. A one-minute chart shows dozens of candles across a single trading session, each one reacting to short-term order flow and noise; a daily chart compresses that same session into a single candle, discarding the intraday swings entirely and showing only where price opened and closed for the whole day. Neither view is more correct than the other; they answer different questions. Someone trying to time an entry within the next hour is looking at a fundamentally different problem than someone deciding whether an asset’s multi-month trend has changed direction, and using the wrong timeframe for the question being asked, reading too much into a five-minute candle when the actual decision is a weeks-long one, is a common way traders talk themselves into overreacting to normal short-term volatility.
Reading the colour
If the close is higher than the open, the candle typically appears green or white, sometimes called a bullish candle, meaning price rose over that period. If the close is lower than the open, the candle typically appears red or black, a bearish candle, meaning price fell. The exact colour scheme is a charting platform’s choice, not a universal standard, so it’s worth confirming which colour means what on whichever chart is being read, though green-for-up and red-for-down has become close to the default on most crypto exchanges and charting tools.
What the shape adds
A long body means a large move between open and close within that period; a short body means the price didn’t move much even if it wandered. Long wicks on either end show the price reached further in that direction before being pushed back by the close of the period, which is often read as a sign that buyers or sellers tried to push price further and failed. A candle with almost no body and long wicks on both sides, sometimes called a doji, shows a period where the price moved a lot but ended almost exactly where it started, often associated with indecision between buyers and sellers.
Volume gives a candle its context
A candlestick on its own tells you where price moved; it doesn’t tell you how much conviction was behind the move. That’s what the volume bars typically shown beneath a price chart are for, each one tallying how much of the asset changed hands during that same period the candle represents. A long-bodied candle on unusually high volume suggests a move backed by broad participation, many buyers or sellers acting at once, while the same shaped candle on thin volume can reflect a handful of large orders moving a comparatively illiquid order book, which is a weaker basis for reading conviction into the move. Crypto markets, particularly for assets outside the largest few by market capitalization, can see volume vary enormously between exchanges and time of day, so a spike in price on a specific platform’s chart is worth checking against volume before treating it as broadly significant.
Patterns are a starting point, not a signal on their own
Traders name recurring multi-candle shapes, engulfing patterns, hammers, morning stars, and treat them as possible signs of a reversal or continuation. These patterns describe what already happened; they don’t predict what happens next with any guaranteed reliability, and relying on a single pattern in isolation, without considering the broader trend, trading volume and the asset’s overall context, is a common way new chart readers overtrade on noise. The practical use of a candlestick chart is building a feel for how price actually moved through a period, not memorizing a shortlist of patterns as trading signals.
The names attached to these formations, hammer, doji, engulfing, morning star, trace back to the same 18th-century Japanese rice trading tradition that produced the chart format itself, refined and popularized in English-language markets much later through the work of technical analysts in the late 20th century. That history matters for how much weight to give a pattern: these are centuries-old heuristics for describing recurring shapes in price data, developed long before modern market structure, algorithmic trading or 24-hour crypto markets existed. They can still describe something real about the psychology of buyers and sellers at a given moment, but they were not built with an asset class that trades continuously across a fragmented set of global exchanges in mind, which is one reason experienced chart readers treat a named pattern as one input rather than a rule.